
Tableau was started in 2003, and it is a business intelligence tool. Tableau allowed you to view your business data visually!
Simply Put – Tableau entirely focuses on Visual Analytics.
In a world where data flows like crazy, visualization can help make quick decisions based on data.
Tableau can support and connect to a wide variety of data sources like the cloud, DBMS, excel sheets and even can connect to real-time data from websites.
What is the Need for data visualization with Tableau?
Your data mostly lies in spreadsheets and rows & columns with numbers and text, so it is hard to identify problems and come up with solutions by just viewing the data in the form of numbers and text on a spreadsheet.
That’s where data visualization helps!
What Tableau does is that at the back end, it writes optimized sequel queries in order to fetch your data from the database and then present it to you in a visual form that is easy to understand, insightful, and attractive – helping understand data much better.
Also, Tableau is easy to use – check out this video:
Prerequisites
Awareness with SQL will be an added advantage and
A basic understanding of Computer Programming jargons and Data analysis with some knowledge of various types of graphs and charts is enough.
Tableau vs. Excel?
Why not excel when it can also can the same problem with charts, graphs, and images, so why Tableau?
The same charts and trend lines would take more time in excel – let say around ten minutes, whereas with Tableau, you can do the same task within seconds and take quick decision with effective data visualizations.
Read: Get started with Google Analytics Certification – GAIQ
Who uses Tableau?
From fortune 500 companies to small & medium-sized businesses, universities, government agencies, and research institutions, a wide range of companies use Tableau.
Companies like Amazon, Experian, Linkedin, Unilever, Red hat, Siemens, JPMorgan, and many more uses Tableau to examine, explore, visualize, and securely share data in the form of Workbooks and Dashboards.
Gartner published the 2021 Magic Quadrant for Analytics and Business Intelligence Platforms. Gartner has again recognized Tableau as a Leader—for the ninth consecutive year. Read the 2021 report for Gartner analysis.
Let’s look at a situation:
Suppose you are an employee for a large business or a retail chain. Your administrator just got the periodic sales report and remarked that sales seem better for some products than others.
Now you are responsible for analyzing the trend, looking at what’s working, and contributing to overall and profit.
Your boss is interested in the bottom line And also asked you to identify areas for improvement and present your findings to the team.
The team can explore your results and take action to improve sales and profitability for the company’s product lines.
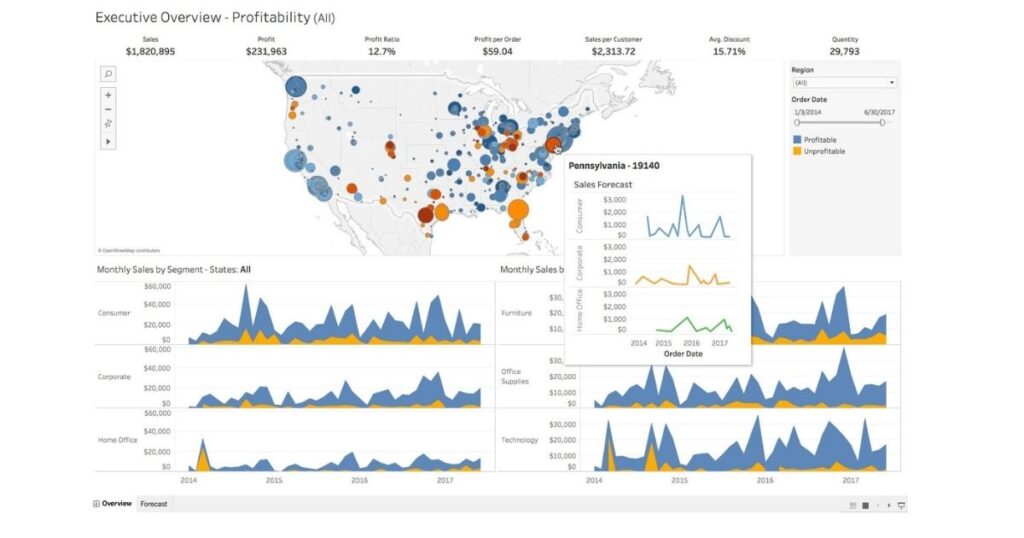
You’ll use Tableau Desktop to build a simple view of your product data, map product sales and profitability by region, build a dashboard of your findings, and then create a story to present. Then, you will share your results on the web so that remote team members can take a look.
And it’s really simple to work with, Check out this demo video by Tableau.
Why use Tableau?
It helps organize data in a simplified manner and turn raw data into a very easily understandable format that can be understood by professionals at any level in an organization also is easy to understand by a layman.
Tableau makes business analysis/data analysis really fast with stunning visualizations, and that is why it is used widely for creating and distributing dashboards and worksheets.
The best thing about Tableau is that it doesn’t require any programming skills or hard-core technical skills. The tool is used amongst people from all sectors such as businesses, startups, retail stores, researchers, and many different industries.
Data Visualization is an unavoidable aspect of business analytics and with the humungous rise of data sources, business managers prefer using data visualization tools that allow them to analyze data and trends in a much simpler and impactful form leading to making quick data-driven decisions.
Tableau is one of the fastest evolving Business Intelligence (BI) and data visualization tools with easy to use user interface. It is very fast to deploy, easy to learn, and very intuitive to use for a customer.
Tableau Benefits:
- User friendly
- Data Blending
- Speed
- Real-time analysis
- Beautiful and Interactive Dashboard
- Direct Connection
- Easy publishing and sharing
- Collaboration of data
- Growing Market
Why should you learn Tableau in 2021?
Let’s start with the most interesting point that everyone wants to know – how much a tableau professional earns?
The avg salary of a Tableau professional is around $106,000 per annum. The highest salary noticed in this line of business is about $158,000 per annum. Another fundamental reason is that it helps to enhance the individual’s career growth.
The most popular reason to learn Tableau is that it presents different job roles. People looking to start their career in Tableau can pick their best profession from the list below:
- Tableau Developer
- Senior Tableau Developer
- Data Analyst
- Tableau Consultant
- Software Engineer
- Business Intelligence Developer
- Business Intelligence Analyst
- Business Intelligence Manager
- Business Analyst
Certified Tableau professionals will have a high possibility of getting opportunities from top companies for various roles and making higher salaries than their peers.
The concluding assuring reason to learn Tableau is a secured career. In the field of BI & Data visualization, it is a widely used tool. The future of Tableau as a career is bright and secure.
Tableau Products:

Tableau Desktop
The main development tool in the tableau software suite is Tableau Desktop. With Tableau desktop, you can connect to numerous data sources, connect your data in your local system, connect to cloud data databases, connect to cloud applications, and connect to big data with tableau desktop.
Tableau Desktop is a perfect development tool where you can create Powerful visualizations and dashboards that you wish to share across your organization or within a team.
Tableau Reader
Tableau reader is just for viewing purposes – if someone has created a dashboard or a workbook in the tableau desktop, you can view it. You can interact with the visualization with a filter but cannot make any changes to the dashboard.
Tableau Public
Tableau public is also used for creating dashboards and worksheets – the only difference is that you cannot save workbooks in your system. You have to publish it in the tableau server where it’ll be available publicly, and it also has limitations to connect to data sources, unlike tableau desktop.
Tableau Server
It is an enterprise-level sharing tool – you can share your dashboard at the enterprise level and is secure and reliable.
Tableau Online
This is just Tableau hosted in the cloud. You can view your dashboard and workbooks created in tableau desktop in Tableau online.
Tableau Certification Levels
There are five main certifications:
- Desktop Specialist Certification
- Desktop Certified Associate Certification
- Desktop Certified Professional Certification
- Server Certified Associate Certification
- Server Certified Professional Certification
Check out: Tableau Desktop Specialist Certification Practice Exams & Video course
Cost of each certification:
- Desktop Specialist: $100
- Desktop Certified Associate: $250
- Desktop Certified Professional: $600
- Server Certified Associate: $250
- Server Certified Professional: $800
Conclusion
Today most of the business and companies use Tableau to analyze data in a better way! Building a career in the domain can be a good step towards a secure career. Get certified and skilled in tableau and grab a job in a reputed company!
Happy Leaning!
ReviewNPrep’s community of users helps each other with career journeys and identifies trends and latest resources through valuable discussion forums.